–Shakti Ballav Koirala
NEPSE: Weekly wrap-up
(29th march, 2021 – 1st April, 2021)
This week started colorful with different colors of Holi while ended alongside greenish color of market.
NEPSE index surged 3.25% with total turnover of Rs 23.5 Arba. This turnover amount is 18.7% less than the previous week, mainly due to one less trading day for this week.

Sector wise performance
All the listed sectors except finance and Hotel & tourism got increased in their value.
- Hydropower companies were the top gainers with weekly gain of 7.7%
- Hotel and Tourism were the top losers with weekly loss of -3.9%

Top gainers and losers
- WOMI and AIL were the top weekly gainers with rise of 33%. They are than followed by MLBSL, SMFBS, SJCL.
- MLBBL, UMRH and USLB were the top losers with double digit fall. They are followed by SLBS, SNLB.
Where are we now?
(Analyzing market from technical point of view)
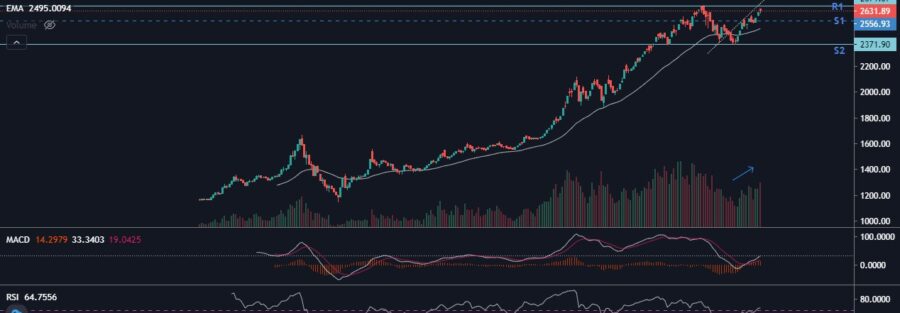
Current NEPSE index: 2631.89
Support(S1) = 2550 – 2560 Resistance(R1) = 2650 – 2670
Support(S2) = 2370 – 2380 Resistance(R2) = 2960-2970

As seen in the chart, after a minor correction, NEPSE index is again approaching its all-time high of 2673.8 points. The recent rise is also supported by volume which is a typical behavior of bull market. Now the immediate major resistance is at 2650 -2670 zone while immediate support being 2550 – 2560 zone.
Relative strength Index (RSI): On Daily chart, NEPSE has closed at RSI of 64.75. RSI above 60 indicates growing bullish sentiment.
Exponential Moving Average (EMA): Since the beginning of current bull market, 35 days EMA have been a significant support for NEPSE. Recently, NEPSE index is trading above this support.
MACD: MACD is in positive territory with MACD line surpassing signal line to form a golden cross. This suggests a buying position
Candlestick: looking at this Thursday candlestick pattern, we can see a rough hanging man pattern which suggest possible price rejection before moving higher. However weekly candlestick is bullish.
Darvas Box pattern
The Darvas Box Theory is a trading strategy invented by successful trader, Nicolas Darvas, who used to target stocks with price and volume as indicators.

Since 2020, NEPSE index has already formed 3 significant Darvas Box Patterns in Daily chart. This time, as NEPSE is trading around its all-time high, we can see another Darvas box pattern formation as given in the figure.
This Darvas Box pattern can be a good opportunity for traders to profit from trending Market. Traders can initiate buy position, once the index gets out of the box from top (2670), keeping stop loss at bottom level of the box (2370) and Target equals to height of the box (2970).
Where are we heading?
((Analyzing market from technical point of view)
Stock price seems random, but there are repeating cycles. Every bull market is followed by bear market and vice versa. NEPSE had made its past cyclical highs in 2008 and 2016 followed by subsequent fall. Now in 2021, when market is continuously surging by making higher highs, everyone wishes to know that peak point where we could get out full hand before any major fall. Here is where Fibonacci extension may help us.
The chart given below is the NEPSE weekly chart from 2004 to present. We can see that the peak of (2012 to 2016) bull market at 1882 points was the 160% extension of its preceding (2004 to 2008) bull market. So, if an investor after 2012 had used Fibonacci extension and made a target of 160% extension, he could have timed the market.

The chart given below is same chart but with Fibonacci extension drawn for the current bull market. Assuming that this bull market will also get extended to 160% of its preceding bull market (2012 to 2016), NEPSE index will likely make its peak at 3641.33 level.

Conclusion
At present, NEPSE index is trading around 100% extension of its preceding bull market of (2012 to 2016). Although we may see some selling pressure in short term, the primary trend is still bullish. As, discussed earlier in the weekly wrap up, MACD and leading indicators like RSI have shown probable chance of breakout of (2660- 2670) resistance zone. However, we can’t ignore any other indicators or fundamentals and macroeconomic factors. Rest, anything is not sure until it happens.